Tagged: sulfur dioxide
Sulfur dioxide emissions in China
Sulfur dioxide is a component of air pollution that leads to the formation of smog and acid rain and can cause some nasty respiratory illnesses. Shit’s bad news. The burning of coal makes up 90% of sulfur dioxide emissions. I’m currently researching sulfur dioxide emissions at a particular power plant in Linfen, but in addition to that, I’ve been compiling data on macro-level sulfur dioxide. Here are some lovely graphs and tables for everyone’s edification and a brief context for that staple of the planned economy, the five-year economic plan of China.
China’s sulfur dioxide emissions from 2005-2010 are as follows:
Year Sulfur dioxide (tonnes)
2005 25,494,000
2006 25,888,000
2007 24,681,000
2008 23,212,000
2009 22,144,000
2010 21,851,000
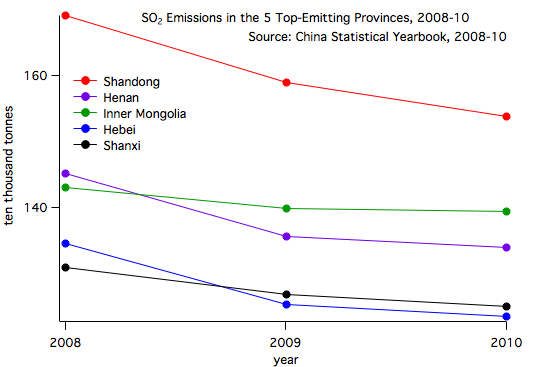
The highest sulfur dioxide emitting provinces in 2010 are as follows:
Province sulfur dioxide (tonnes (2010))
1. Shandong 1,538,000
2. Inner Mongolia 1,394,000
3. Henan 1,339,000
4. Shanxi 1,249,000
5. Hebei 1,234,000
The highest sulfur dioxide emitting provinces in 2010 per capita, however, are as follows:
Province sulfur dioxide (tonnes per capita (2010))
1. Ningxia 0.055
2. Inner Mongolia 0.052
3. Xinjiang 0.028
4. Shanxi 0.026
5. Jilin 0.021
As usual, the significant figures are iffy because I don’t know the uncertainty on the data that I have. Notice all the provinces are in the north. Ahh, bless the north with its bountiful noodles, gangly demographics, and sulfur dioxide! Also, after an admittedly not thorough literature search, it is unclear to me why these provinces are the most emitting per capita. Some papers claim it is linearly related to GDP per capita, which makes sense, but I’m not going to pretend that I did any research into whether or why Ningxia has a high GDP per capita. But then some papers say that there is no correlation. I just know that Ningxia is known for its grapes. We all know that…people working in the grape industry…need to burn coal…ok, I’m pulling this out of my ass. I doubt that grape production is correlated with sulfur dioxide, but perhaps that is a masters thesis waiting to be written! You’re welcome, hypothetical graduate student!
To put these numbers in rough context, the data I got from my power plant in Linfen says that pre-scrubbing, the sulfur content of the total coal burned per day is on average 100 tonnes. That means that if all of that sulfur is converted to sulfur dioxide, the mass is around 200 tonnes. But if we assume the desulfurization equipment can get rid of 90% of the sulfur dioxide, that means that a single, modern 600MW power plant emits about 20 tonnes of sulfur dioxide per day. So China’s total sulfur dioxide emissions per year is EQUIVALENT to about the SO2 emissions of 3000 power plants of the specs I’ve assumed above.
China realized on paper that they needed curb their emissions during the tenth five-year plan (2000-2005). In the tenth five-year plan for energy conservation and emissions reduction (节能减排第十五规划), they set a target to reduce SO2 by 10% compared to 2000 levels, but sulfur dioxide emissions actually increased 42% during that period. They fucked that one up, but many people probably got shiny BMWs out of all of it.
They did better during the eleventh five-year plan (2005-2010). They actually reduced SO2 by 14% from 2005 levels! This is especially impressive because the economy was developing and electricity generation actually grew by nearly 80% in this time period. Flue-gas desulfurization (FGD), or scrubbers, were installed on 86% of all power plants by the end of 2010, compared with 14% by the end of 2005. Schreifels’s paper (see below) cites six factors for the reduction in emissions: (1) the instruments used to outline the goal, (2) the political commitment to enforce the emission targets, (3) Central government accountability for provincial and local officials and power company executives, (4) verification of emission measurements by the Central government, (5) greater government focus at all levels on the SO2 goal, and (6) revised policies and programs that placed an emphasis on performance and incentives. I’m not going to write out all the details because really you should read the paper, because it’s awesome. It’s quite specific about how incentives, enforcement, and better coordination between governmental bureaus have curbed SO2 emissions.
REFERENCES
Basically everything on the history of policy is from this article and this article, and all my numbers from the China Environmental Statistical Yearbook. The most recent data I could get was from 2010. Full citation below:
Schreifels, J.J., Fu, Y., Wilson, E. J. Sulfur dioxide control in China: policy evolution during the 10th and 11th Five-year Plans and lessons for the future. Energy Policy, September 2012.
Gao, C., Huaqiang, Y., Ai, N., Huang, Z. Historical Analysis of SO2 Pollution Control Policies in China. Environmental Management, January 2009.
Converting emissions standards, China vs. U.S.
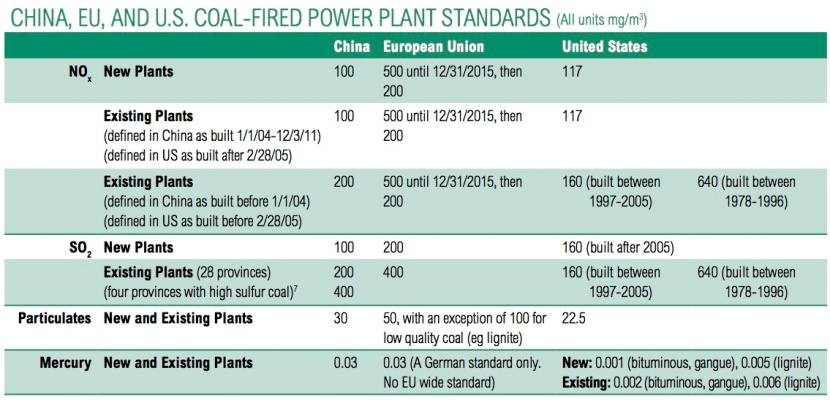
The table above managed to cause me about a month’s worth of confusion. Fucking table. The purpose of this blog entry is for those who hate English units, hate conversion factors of vague origins, or just hate a lot of things in general. Hate is the theme of this post. That and pollution. I hate pollution. Anyway, I hope the following post will save you the confusion it caused me. Acknowledgments to Jeremy Schreifels, who sent me lots of good resources for deciphering this mess.
China’s new air pollution standards went into effect on January 1, 2012. These new standards, much more strict than the previous ones established in 2003, are finally on par with the rest of the world (see above table). I’m in the business of sulfur dioxide standards, so I started staring at the table and comparing the U.S. standards to China’s. China’s standards are in mg/m3, i.e. milligrams of sulfur dioxide per cubic meter of flue gas. The U.S.’s standards are in lb/millionBtu(mmBtu), or pounds of sulfur dioxide per million Btu of coal. But if you look at the table, someone already did the dirty work and converted the U.S. units of lb/mmBtu into mg/m3. But for those of us who are analytical and shit, this was actually a disservice. I want to know where the numbers come from, dammit!
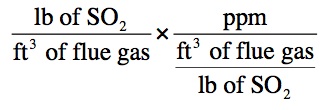
The conversion is not just your simple English-to-metric wahoo. The pounds-to-milligrams and cubic-feet-to-cubic-meter stuff is trivial. We have to do one key conversion (Eq.1): The first factor on the right is what U.S. EPA standards are defined in. How do we find the second factor? Turns out its reciprocal is something called the F-factor, which is a ratio of flue gas produced per heat generated by a fuel. F-factors are determined by using stoichiometric calculations, explained further on this EPA page.
This conversion assumes that we are using bituminous coal, which has an F-factor of 9780 dscf/mmBtu or 1800 scf CO2/mmBtu. (Here dscf stands for “dry standard cubic feet” and scf stands for “standard cubic feet,” and scf CO2/mmBtu means standard cubic feet of CO2 emitted per mmBtu of coal.)
So, for an example: the US standard for SO2 new coal power plants is 0.15 lb/mmBtu. We divide by the bituminous coal F-factor, 1800 scf CO2/mmBtu to get (lb of SO2/cubic feet of CO2). Then we divide that by 12% because we assume that takes CO2 up 12% of the volume of gas. Then we convert lb to mg (1:4.54E5) and cubic feet to cubic meters (3.28^3:1), and we get about 160 mg/m3, and we’re done.
To summarize, the assumptions made in this conversion:
1) The coal plants use bituminous coal of F-factor 9780 dscf/mmBtu or 1800 scf CO2/mmBtu.
2) Flue gas is 12% CO2.
EPILOGUE
Another useful unit in emissions standards is ppm, parts per million by volume. I’m not going to lie, I didn’t try to dissect this one to pieces. The conversion looks like this (Eq. 2):
We got the term on the left of Eq. 2 by using Eq. 1. Now we want to convert that number into ppm, so we need the factor on the right. This term is called the K value and it comes from the ideal gas law. To do this we have to convert mass to volume, so we have to assume all sorts of things about pressure and temperature. I’m not going to go into detail on this one because, well, I haven’t had to deal with ppm yet. The K-value for SO2 is 1.66E-7 (pounds of SO2/cubic feet of flue gas/ppm).
References:


